Datadog + OpsLevel Benefits
Integrating OpsLevel and Datadog makes it easy for anyone in your engineering organization to see the statuses of all your monitors in real time, alongside the complete context of your service catalog.
For SREs, platform engineering, or engineering management, OpsLevel can be used to ensure Datadog monitors are configured correctly and active on all the relevant services.
How it Works
OpsLevel’s Datadog integration listens for any status changes in your associated Datadog monitors.
Status Levels
The relationship between Datadog monitors and linked alert sources on OpsLevel services follows the pattern below:
| Datadog monitor | Linked OpsLevel service |
|---|---|
| No Data | gray No Data state |
| Alert | red Alert state |
| Warn | orange Warn state |
| OK | green OK state |
Datadog Usage Checks
For guidance on setting up a check to verify Datadog is used on all services in your catalog, read more on Alert Source Usage Checks here.
Requirements
OpsLevel’s Datadog integration relies on receiving webhooks from Datadog, so in addition to having active accounts on OpsLevel and Datadog, a user must provide Datadog’s API and APP keys. The Datadog’s user must be an Admin.
Support
OpsLevel support is available at support@opslevel.com or via your shared OpsLevel Slack channel.
Installation
Installing the Datadog integration can be completed in seconds.
- In the OpsLevel app, from the left-hand menu, navigate to Integrations and click the New Integration tile.
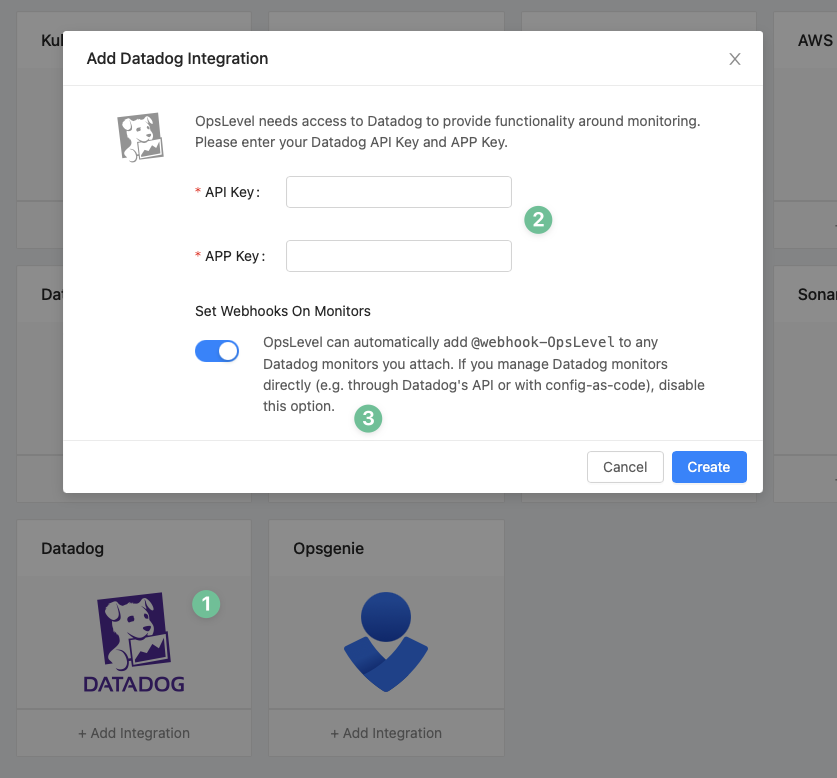
- Click the Datadog tile and then enter your API and APP keys.
- Make sure @webhook-OpsLevel gets added to any Datadog monitors that you attach to OpsLevel Services. OpsLevel can automatically do this on your behalf if the Set Webhooks On Monitors option is enabled. If you prefer to manage your Datadog monitors directly (e.g. through Datadog’s API or with config-as-code), disable this option.
On the next screen you’ll be presented with a detailed getting started guide to configure webhook delivery from Datadog to OpsLevel.
How to attach a Datadog monitor to a service in OpsLevel
There are two ways to attach a Datadog monitor to an OpsLevel service. Automatic and Manual
Automatic attachment
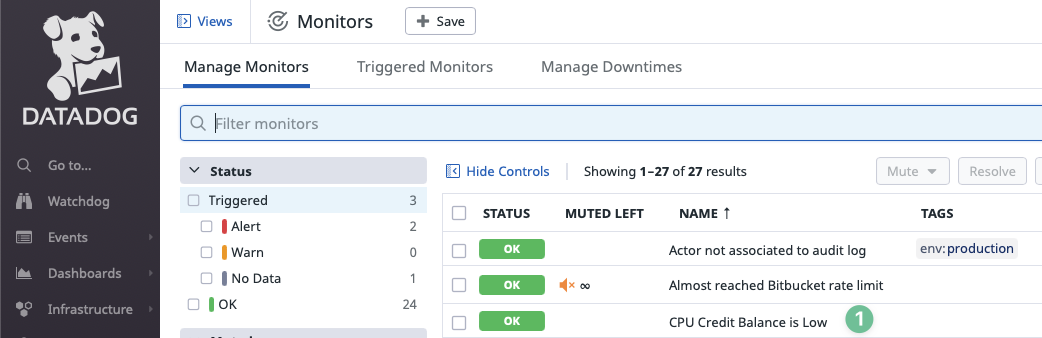
First, log into your Datadog account and navigate to the Monitors page.
- Click on the monitor you want to be automatically attached.
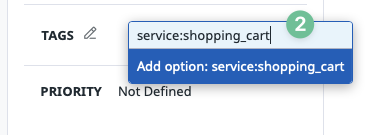
- Add a tag following the
service:service_aliaspattern. Any of the aliases registered for the service can be used. Tip: The tag in the Datadog monitor is case-insensitive.
- Ready! Your monitor will be attached to the service automatically.
Note: If a tag was removed from the Datadog monitor, the link with the service will not be automatically removed! If you want to remove it, you have to do it manually.
Manual attachment
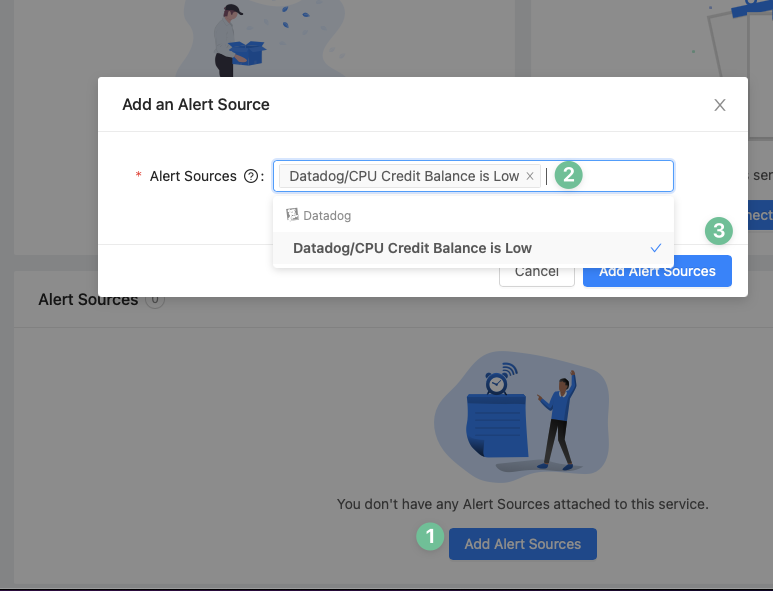
First, navigate to the Operations tab of an OpsLevel service.
- As shown in the screenshot below, Select Add Alert Sources
- In the drop-down menu, find and select the correct Datadog monitor (you can type its name to search)
- Click the Add Alert Sources button on the dialog box to save your selection(s)