Add a Datadog Check Integration
- In the OpsLevel app, Click Integrations in the left sidebar.
- Click on the + New Integration button.
- Click the Datadog Check tile to add the integration.
Create a Check
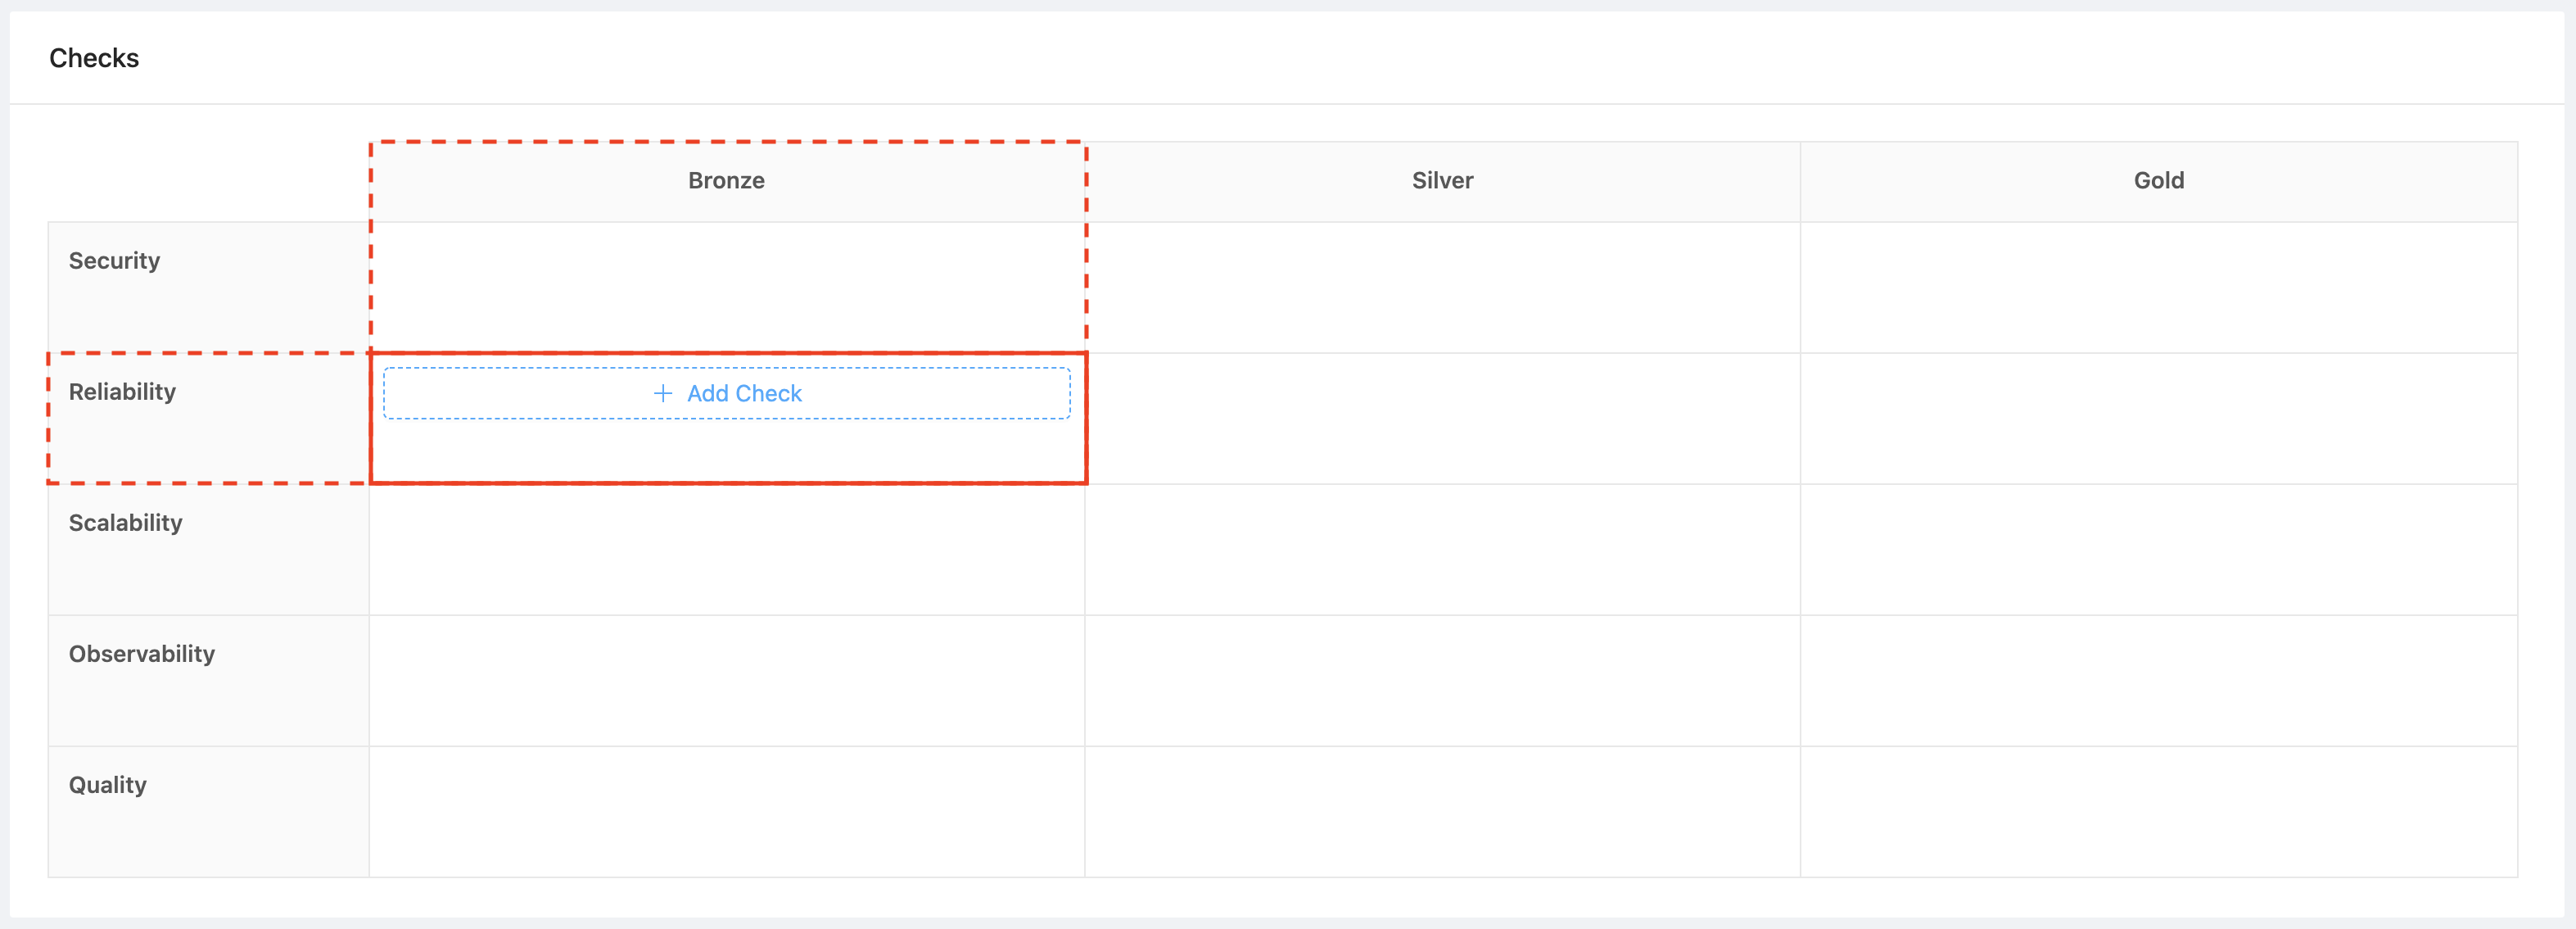
- Navigate to the Rubrics sub menu under the Service Maturity menu in OpsLevel
- Hover over the cell that corresponds to the level and category you want your check to live in and click the + Add Check button.
- Select the Datadog check to start creating the check (the Datadog Check integration will be automatically selected in the Integration dropdown)
-
Choose one of the Check Templates from the dropdown.
 Here is what each template is for:
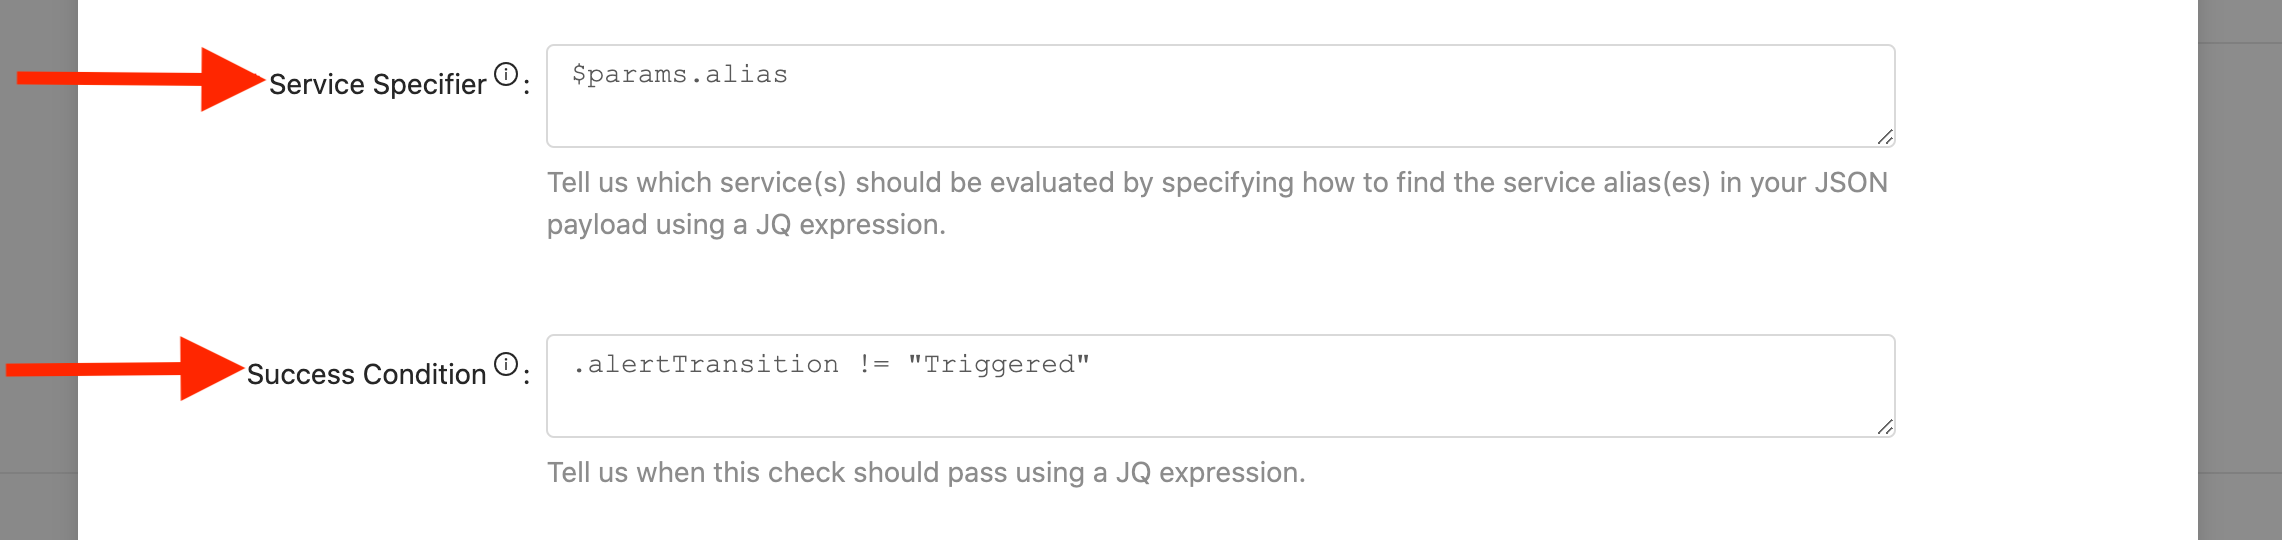
- Check For SLO Error Budget Alert: The check will fail if the alert is triggered.
- We will populate the Service Specifier field, which we use to determine which service to run the check for, and the Success Condition field, which we use to determine if the check should pass or fail. We also provide a sample payload to test the check.
Send payload to OpsLevel
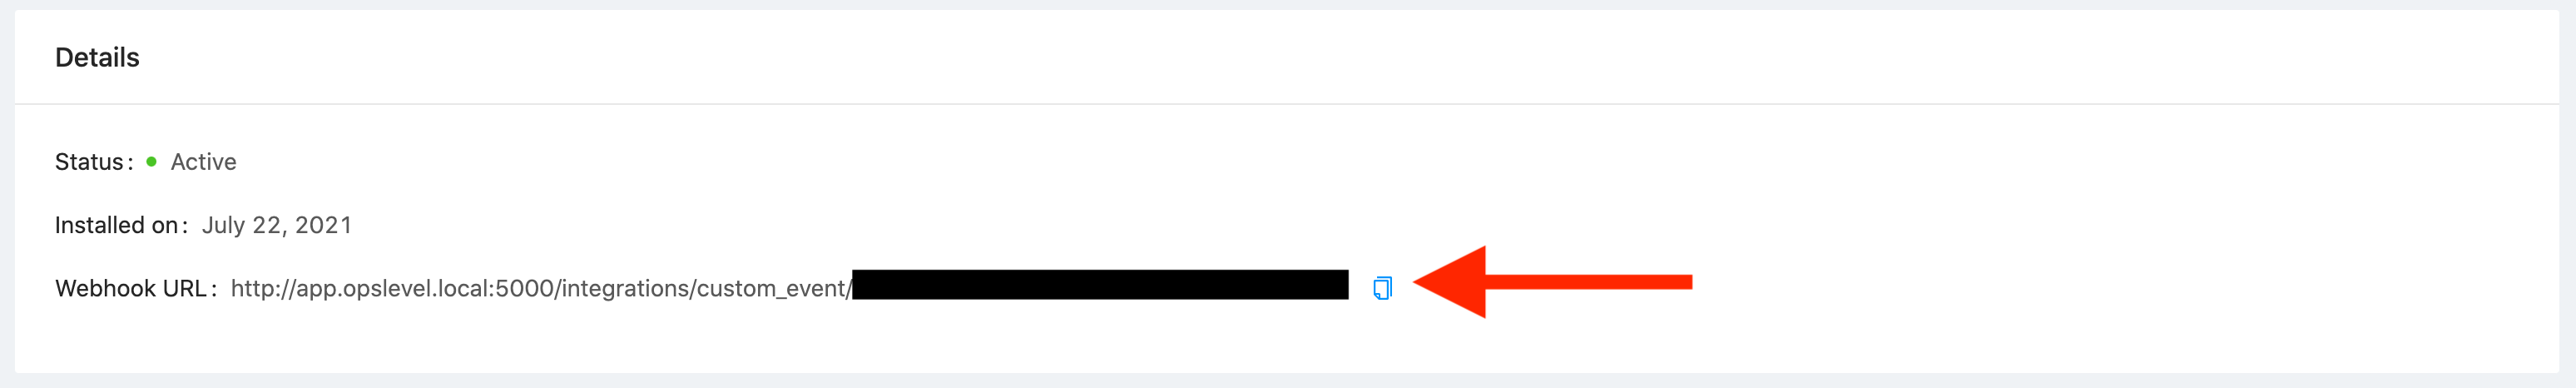
For any Datadog metric alert, you can create a Webhook using the URL from the integration you created above. See here for more details.
If the payload you will be sending in the webhook does not have a service identifier present, we recommend appending a query parameter to your URL like the following: ?serviceAlias=my-service-alias
The minimum set of payload variables we recommend are:
{
    "id": "$ID",
    "body": "$EVENT_MSG",
    "alertId": "$ALERT_ID",
    "eventMessage": "$TEXT_ONLY_MSG",
    "title": "$EVENT_TITLE",
    "url": "$LINK",
    "alertTransition": "$ALERT_TRANSITION",
    "hostname": "$HOSTNAME",
    "orgName":"$ORG_NAME",
    "priority":"$PRIORITY",
    "snapshot": "$SNAPSHOT",
    "alertQuery": "$ALERT_QUERY",
    "alertScope": "$ALERT_SCOPE",
    "alertStatus": "$ALERT_STATUS",
    "eventType": "$EVENT_TYPE",
    "lastUpdated":"$LAST_UPDATED"
}
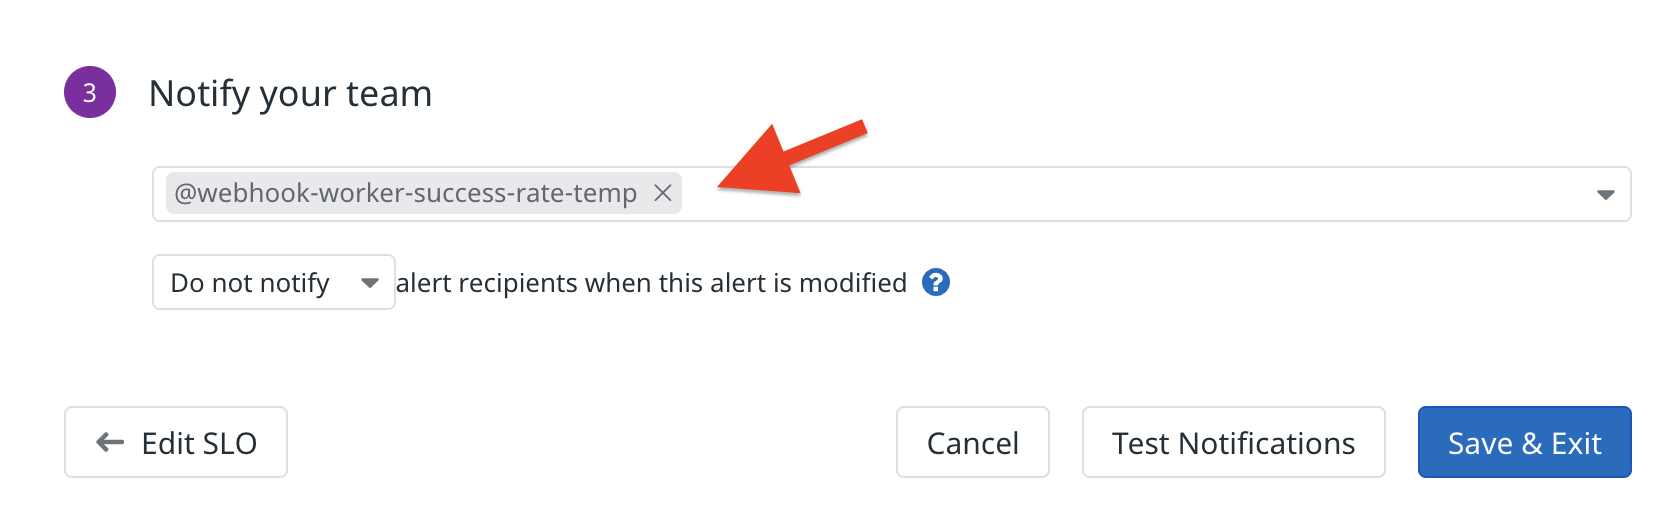
To use your webhook, add @webhook-<WEBHOOK_NAME> in the Notify your team section when creating or editing a monitor alert.